Labor Market Update: Five Data Points All HR Leaders Should Know
February 11, 2020
by Steve Boese
I’ve long been a self-described “labor market data geek.” I look forward to the monthly Bureau of Labor Statistics data releases on jobs, labor turnover, labor participation rates and more. Hearing the latest labor market figures, looking at the trends, seeing how financial and political markets react to the latest data – it’s always been super fascinating to me.
But beyond fascinating or just interesting, I also think that these macro labor market reports are also important – both to financial and political policy makers as well as to business and HR leaders from organizations of all sizes. If there is still a “War for Talent”, and finding and retaining skilled workers is a critical challenge for your business, it helps to understand and contextualize the conditions within which this “war” is being waged. Every new hire contributes to the jobs created number, every existing employee is a part of the labor force participation rate, and every open and unfilled role adds to the job openings/unemployed persons ratio.
While there are literally hundreds of reports and methods of approaching labor market analysis and improving your understanding of these macro labor trends, I thought I would share my personal “top” or “first” five data points and reports I like to look at on at least a quarterly basis. These data points serve as a good foundation from which to continue your analyses – perhaps diving into more granular geographies, job categories, worker demographic classifications and more. So here goes with the data and unless otherwise indicated, all data and graphs come from the excellent St. Louis Federal Reserve’s FRED site – an absolute treasure of information about all things Labor.
(For all graphs, click to enlarge)
1 – US Unemployment Rate
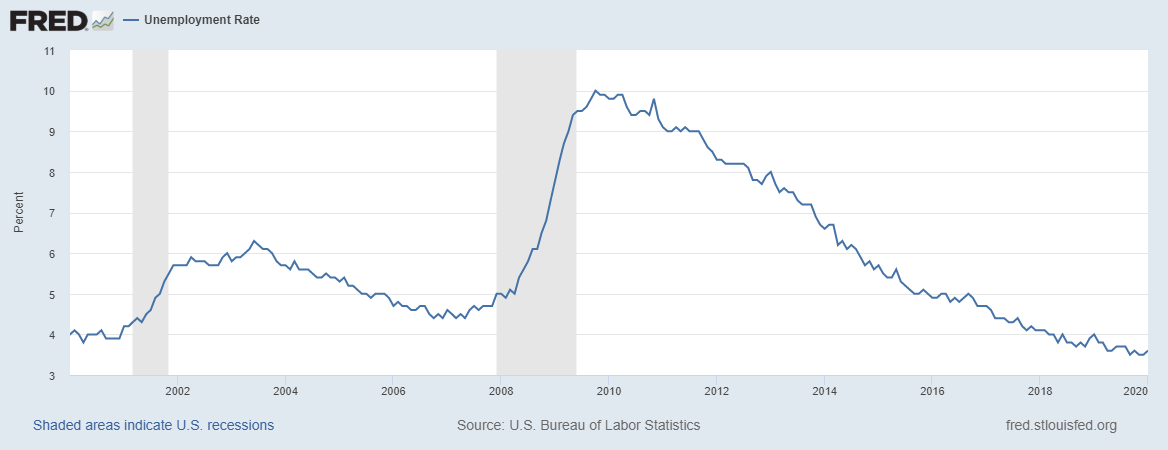
The latest unemployment rate from January 2020 is at 3.6%, near a 50-year low and down from the peak post financial crisis and recession high of 10.0% in October 2009.
2 – Average Hourly Earnings
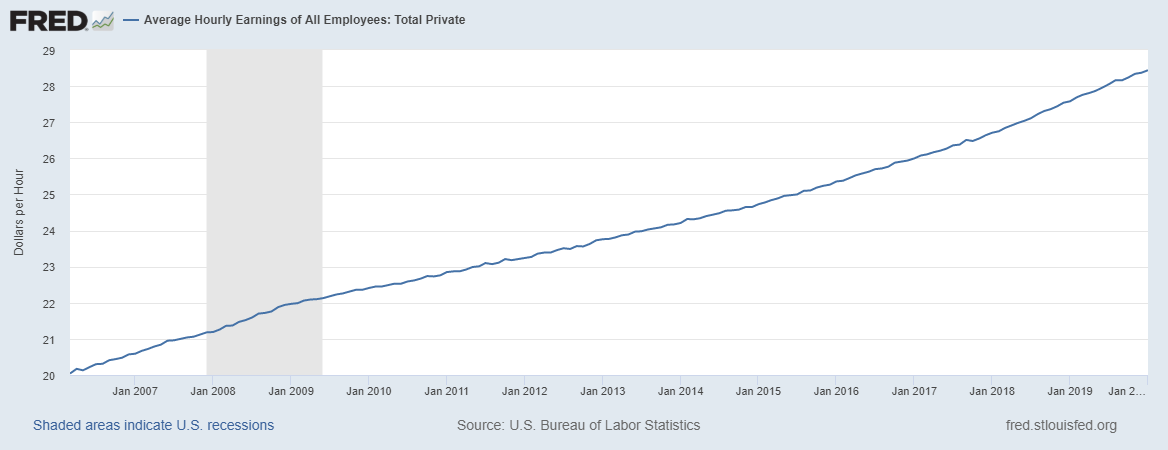
Average hourly earnings in the Private Sector were $28.44 as of January 2020. Overall, hourly earnings have increased on a year-over-year basis at a rate of 3.1%. Hourly earnings tend to increase over time, even in times of recession. The keys to note are wage increases relative to the overall rate of inflation (about 2.3% currently), and the yearly rate of increase.
3 – Job Openings/Unemployed Persons Ratio
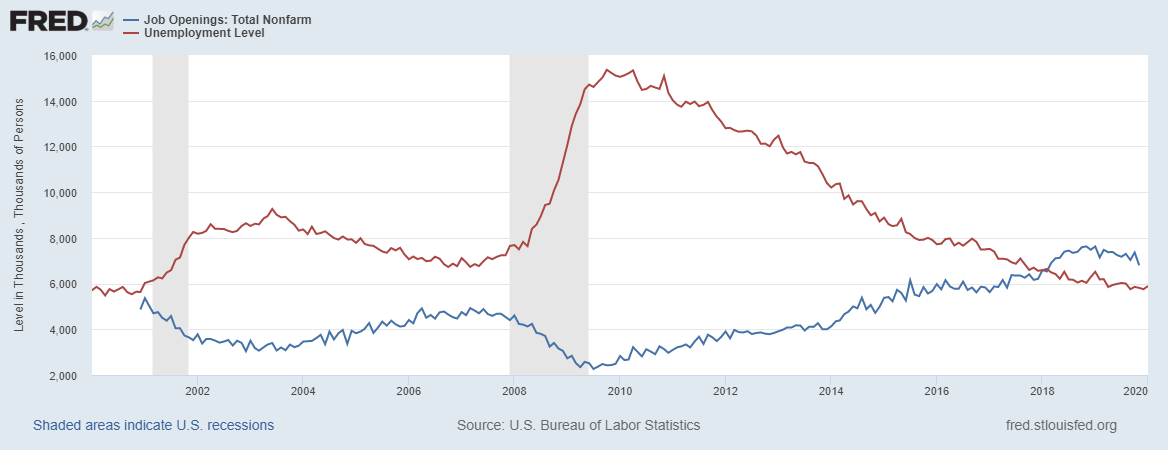
Through the magic of the FRED site, we can create a custom graph combining two data series – Total Job Openings (currently about 6.8 million), and total unemployed persons (currently about 5.8 million). That gives us a current Job Openings/Unemployed persons ratio of about 1.17 – any ratio above 1 indicates more job openings than the number of unemployed persons available to fill these openings. This ratio bottomed out at about 0.16 at the depths of the last economic recession – at that point there were only about 2.5 million open jobs and 15 million unemployed persons.
4 – Employment to Population Ratio
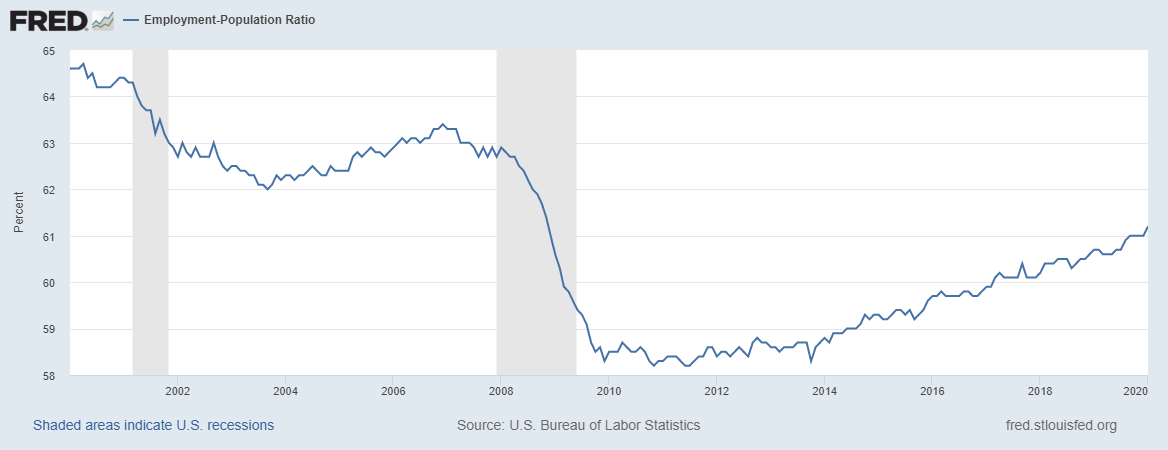
The employment to population ratio is the measure of the civilian labor force relative to the working age population, or said differently, it is the percentage of working age people who are employed full time. The latest data for this ratio shows about 61% of the working age population in the US are indeed employed full time. This is down a few percentage points from the series highs in the early 2000s of about 65%.
5 – Labor Force Participation Rate
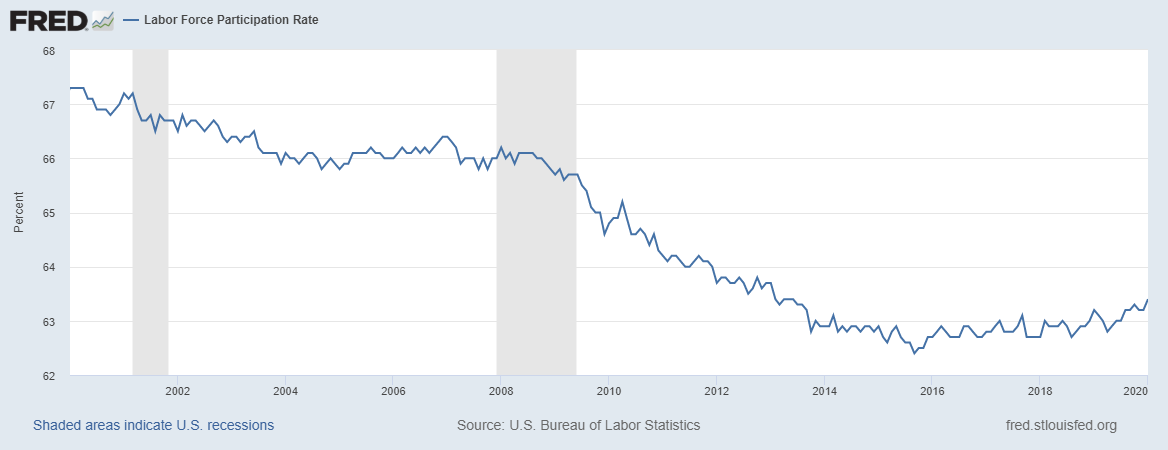
Finally the Labor Force Participation Rate, a widely followed labor market indicator, shows the percentage of the workforce who are either employed, or if they are not employed, are actively seeking employment. By adding in job seekers to the formula, the Labor Force Participation Rate expands upon the employment to population ratio shown above. Currently, the Labor Force Participation Rate sits at about 63% which is also down from early 2000s levels.
The Bureau of Labor Statistics and the St. Louis Federal Reserve do a fantastic job of keeping tabs on the labor market, job growth, wages, and much more. And these sites also make the data accessible and more easily understandable for even non labor market geeks. It is important I think for HR and business leaders to check in with these data sets and macro trends from time to time, as they provide important context and meaning to the more tactical and individual labor and people decisions that you are faced with each day.
And if you do take some time to visit the FRED site and play around with some graphs and charts, be sure to allow yourself plenty of time – it is easy to get lost in all that labor market data!


How we can help
Led by Trish Steed and Steve Boese, H3 HR Advisors harnesses over 40 years of experience to delivery HCM insights and guidance to global organizations.
H3 HR Advisory services
By leveraging technology, analytics, and our deep industry knowledge we can help you to reposition your workforce and ensure that you have the right people with the right capabilities in the right roles to positively impact the growth of your business.
HR Happy Hour Podcast Network
Created in 2009, The HR Happy Hour Show is hosted by Steve Boese and Trish Steed and is the longest continuously running internet radio show and podcast on Human Resources, HR Technology, Talent Practices, Workplace and Leadership topics.
H3 HR Speaking Services
We work closely with every client to customize your content - keynotes, webinars, research, infographics, and buyer’s guides - to inspire, educate and inform the audience enabling you to reset and realign your organization for a talent-led breakthrough.
Get in touch
Talk to us today and find out how we can help you and your organization leverage HCM technology to attract, onboard, retain and manage top talent.